EtherCAT Performance Analysis
EtherCAT remains the fastest Industrial Ethernet Technology
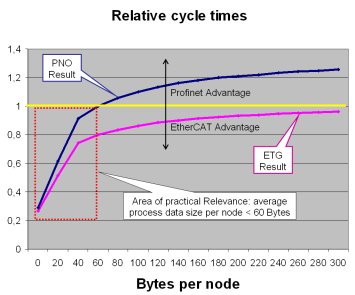
This can also be seen from the following diagram. It shows the relative cycle times of Profinet IRT and EtherCAT over the number of process data bytes per node according to the PNO paper (blue) and according to computations that acknowledge the EtherCAT features mentioned on the previous page (violet). This diagram shows tecat/tpn.

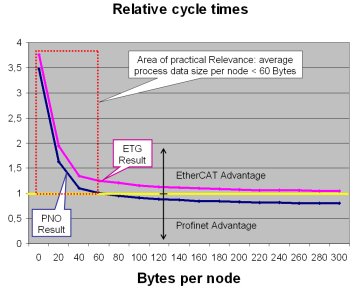
Again we look at the relative cycle times the other way round (now: tpn/tecat):

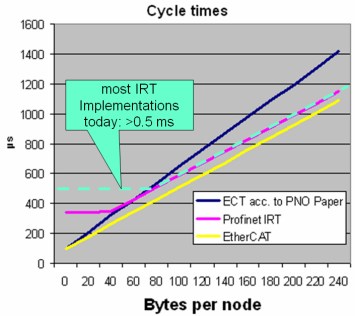
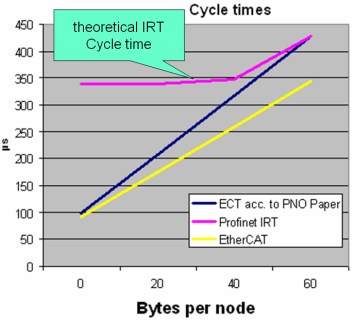
The diagram below looks at the absolute cycle times instead. The violet line now shows the theoretical cycle time of Protinet IRT, the yellow line the EtherCAT cycle time.

The most interesting section of the diagram is the one below 60 bytes per node, since there are hardly any control applications which consist of devices with larger process images. In this section of practcal relevance the perfomance difference between Profinet and EtherCAT is most obvious:

